This is a group project and I’m working with Kimi Toh, Beatrix Julien and Chuantao Zhu.
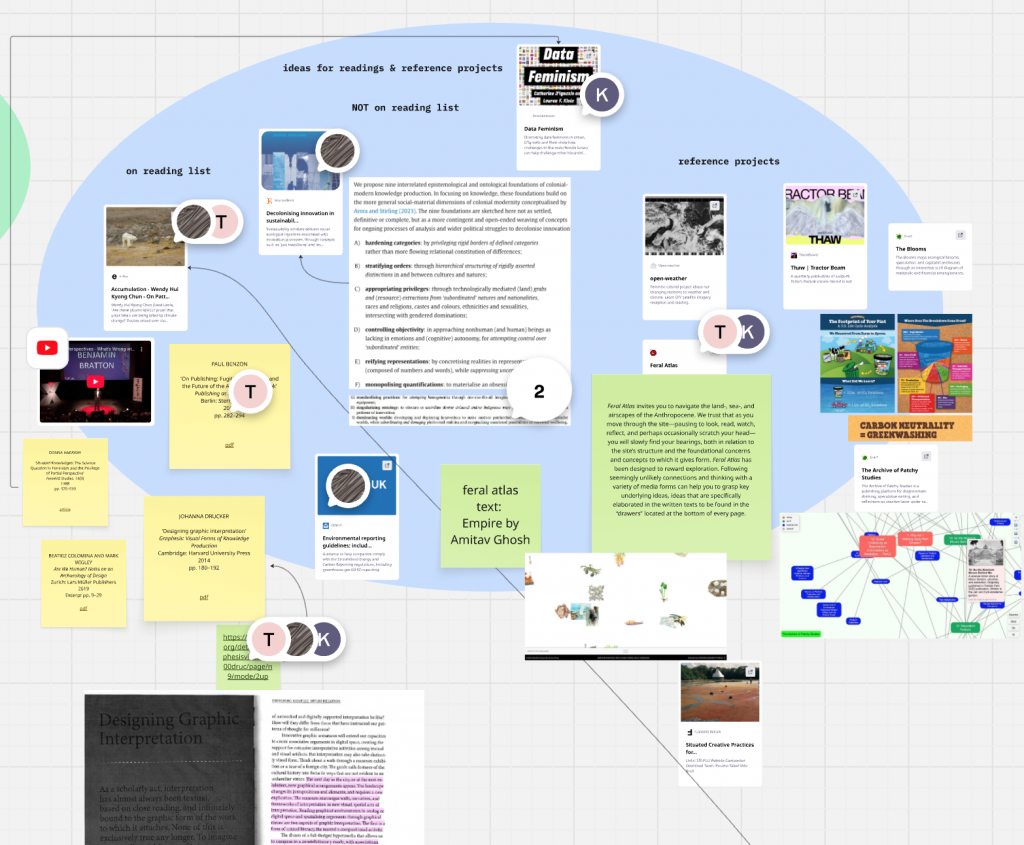
We began this project with a shared Miro board to compile and discuss our readings, initial thoughts and ideas and first experiments. During this time we read widely within the MAGCD reading list and beyond and looked at a range online projects and campaigns to get a sense of how others were communicating climate for a variety of purposes.
First studio experiments
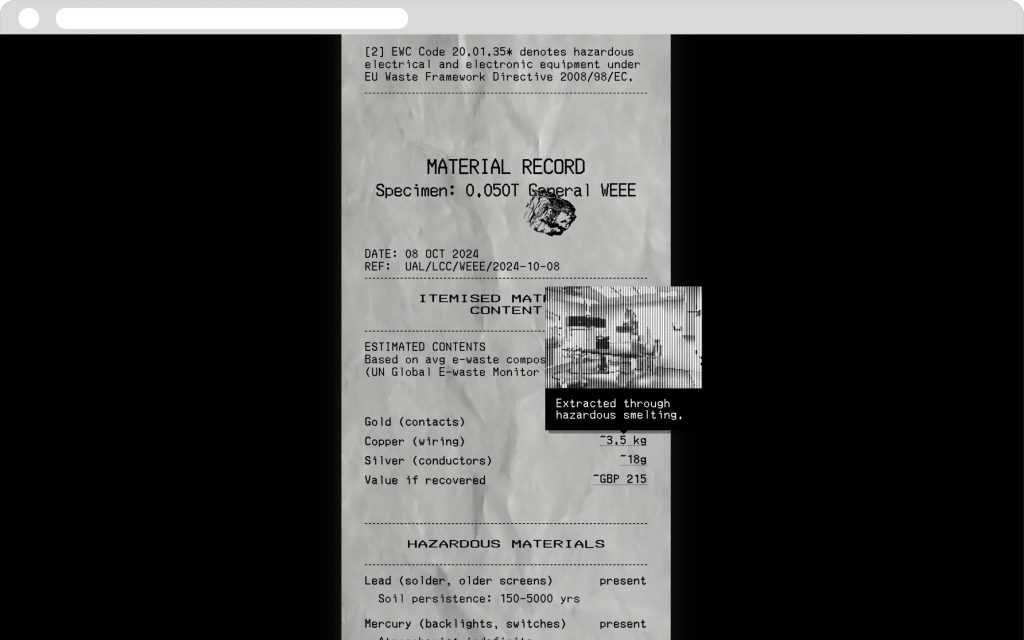
We chose to work with UAL’s waste data as a starting point, looking at what the data itself, even in its ‘under development’ state could tell us. We wanted to test the statement: that by reading an institution’s excrement (trash), you can often understand its real operating model better than by reading its outputs (portfolio of works).
We each experimented with an idea related to our research and the waste data during our first week, coming together mid week to feedback on our work and to finalise our chosen readings.
I chose to look at the waste data in relation to UAL’s supply chain data. Thinking about waste as the end of life carbon data for UALs net zero plan and how that relates to supply chain, in the maturity of emission data collected. Wondering how seeing supply chain and waste data together could help to generate meaning, especially as the current data shows that they produce very different scales of C02e.
I attempted to answer some of these questions, developed with the group:
How could layers of data come together, their data sets showing relations, influence, work-in-progress data and proxies?
Does the interplay between the data silos expose the system boundaries or hide them?
I was inspired by the relational interfaces made by Noam Youngrak Son: The Archive of Patchy Studies and The Blooms.
And also the Feral Atlas and its multiple interfaces for accessing the web publication’s huge range of information: interactive maps, video poems, poems and essays. I’m also interested in what the hand drawn elements are communicating. What they do to shift the tone, to surface the human in this web of feral entanglements.
Consolidating our experiments
After feedback we worked together on single website, using the receipt as the visual form.
Above is a screen recording of the prototype we built. We used AI powered programming environments (VC Studio and Gemini) to achieve the more complex interactions, but they suffer from bugs and glitches which are not intentional.
It is incredible to see code generated so quickly and documented, re-prompted and edited. This has allowed for a speed of prototyping that I’ve never experienced before.
Although we have achieved many unusual effects in our outcome I cannot help but feel that this is more a result of the novelty of the new tool than due to rigorous exploration of the form and medium.
Aspects that I felt were important to our work have gotten lost in the process of synthesis, which is an expected compromise in group scenarios. However with more time to learn to work together and to iterate and reflect on our work I would have liked to see how we could have refocused on showing legible, multiple interpretations of the data and drawing critical connections between the tools we have used, our research and the work of the NZSIP.
Leave a Reply